Students Trained
Workshops Conducted
Practical Learning
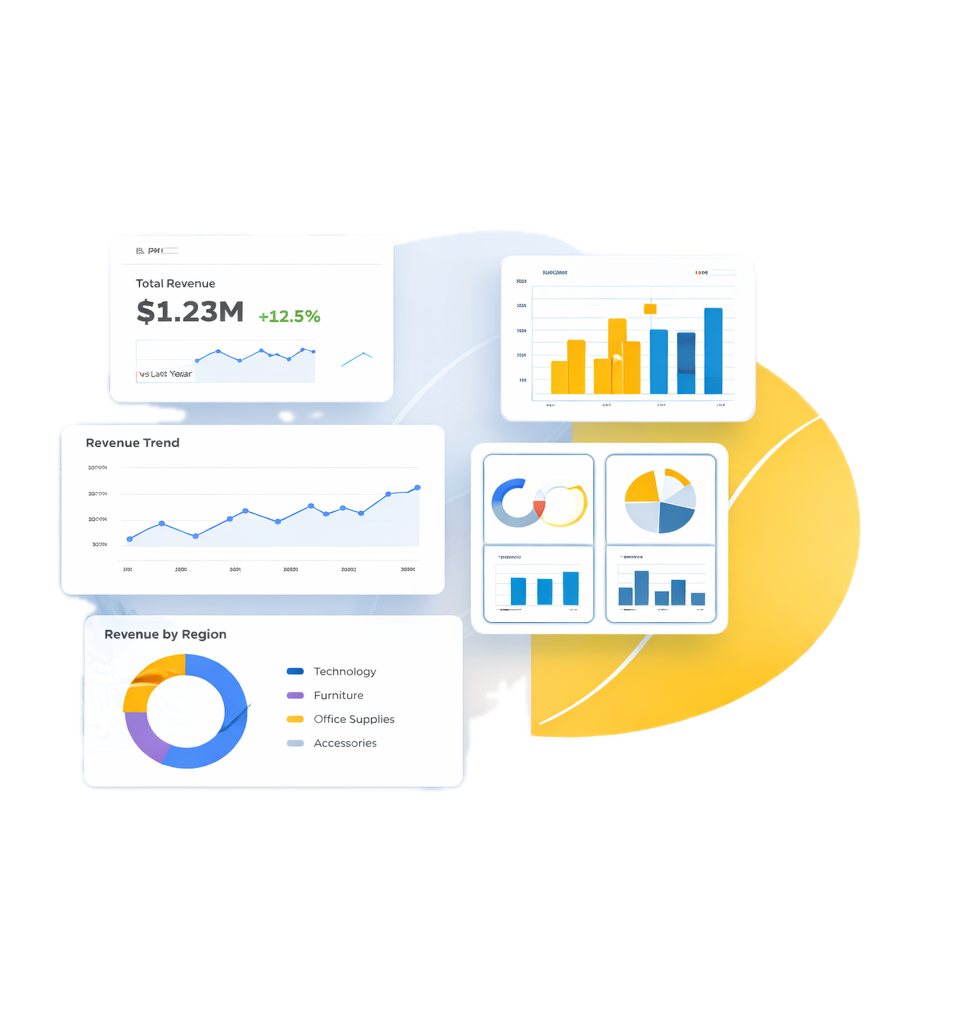
Industry Dashboards
Master Excel techniques used by professionals
Transform messy data into analysis-ready datasets

Learn how businesses analyze data to make smarter decisions
Present complex data in simple visual formats
Build interactive dashboards and visual reports
Gain hands-on experience working with real datasets

Understand Data & Basics Data types, sorting, filtering Basic Excel usage & formatting

Work with Real Data IF, XLOOKUP, SUMIFS Data cleaning techniques Pivot Tables

Turn Data into Insights Charts & reports KPI tracking Data storytelling

Transform Your Data Data import Power Query Data transformation

Build Smart Data Connections Table relationships Star schema design

Advanced Calculations Measures & calculated columns KPIs & business metrics

Build Real-World Projects Sales dashboard HR dashboard Financial reports
Get Job Ready Portfolio creation Resume building Interview preparation


Lorem ipsum dolor sit amet, consectetur adipiscing elit. Curabitur laoreet cursus volutpat. Aliquam sit amet ligula et justo tincidunt laoreet non vitae lorem. Aliquam porttitor tellus enim, eget commodo augue porta ut. Maecenas lobortis ligula vel tellus sagittis ullamcorperv vestibulum pellentesque cursutu.

Lorem ipsum dolor sit amet, consectetur adipiscing elit. Curabitur laoreet cursus volutpat. Aliquam sit amet ligula et justo tincidunt laoreet non vitae lorem. Aliquam porttitor tellus enim, eget commodo augue porta ut. Maecenas lobortis ligula vel tellus sagittis ullamcorperv vestibulum pellentesque cursutu.

Lorem ipsum dolor sit amet, consectetur adipiscing elit. Curabitur laoreet cursus volutpat. Aliquam sit amet ligula et justo tincidunt laoreet non vitae lorem. Aliquam porttitor tellus enim, eget commodo augue porta ut. Maecenas lobortis ligula vel tellus sagittis ullamcorperv vestibulum pellentesque cursutu.